Case Study
HIRSCHTEC: mastering real-time analytics and resource planning
How does a leading specialist for digital workplaces manage its own internal performance? Discover how HIRSCHTEC uses troi to transform raw data into actionable insights, tracking everything from billable utilization to long-term revenue forecasts across five international offices to enable faster, data-driven decisions.
Profile
HIRSCHTEC has been active since 2005 and focuses on digitizing internal communication and collaboration. As a full-service agency for digital workplaces, it has over 100 employees and offices in Hamburg, Düsseldorf, Berlin, Vienna and Zurich. Customers include organizations such as Deutsche Bahn, Deutsche Bundesbank, Air Liquide, Siemens Gamesa, Ricola, Wiener Städtische Versicherung, FRoSTA and Weleda.
 Anke Preisse, Finance Manager, HIRSCHTEC
The challenge
HIRSCHTEC needed reports that clearly displayed team performance, utilization at team and individual level, revenue distribution, project margins, and remaining budget analysis, distinguishing between billable and non-billable activities. In addition, the company required forecasting capabilities to support better resource planning. The key figures were based on hour, revenue and budget data.
The solution
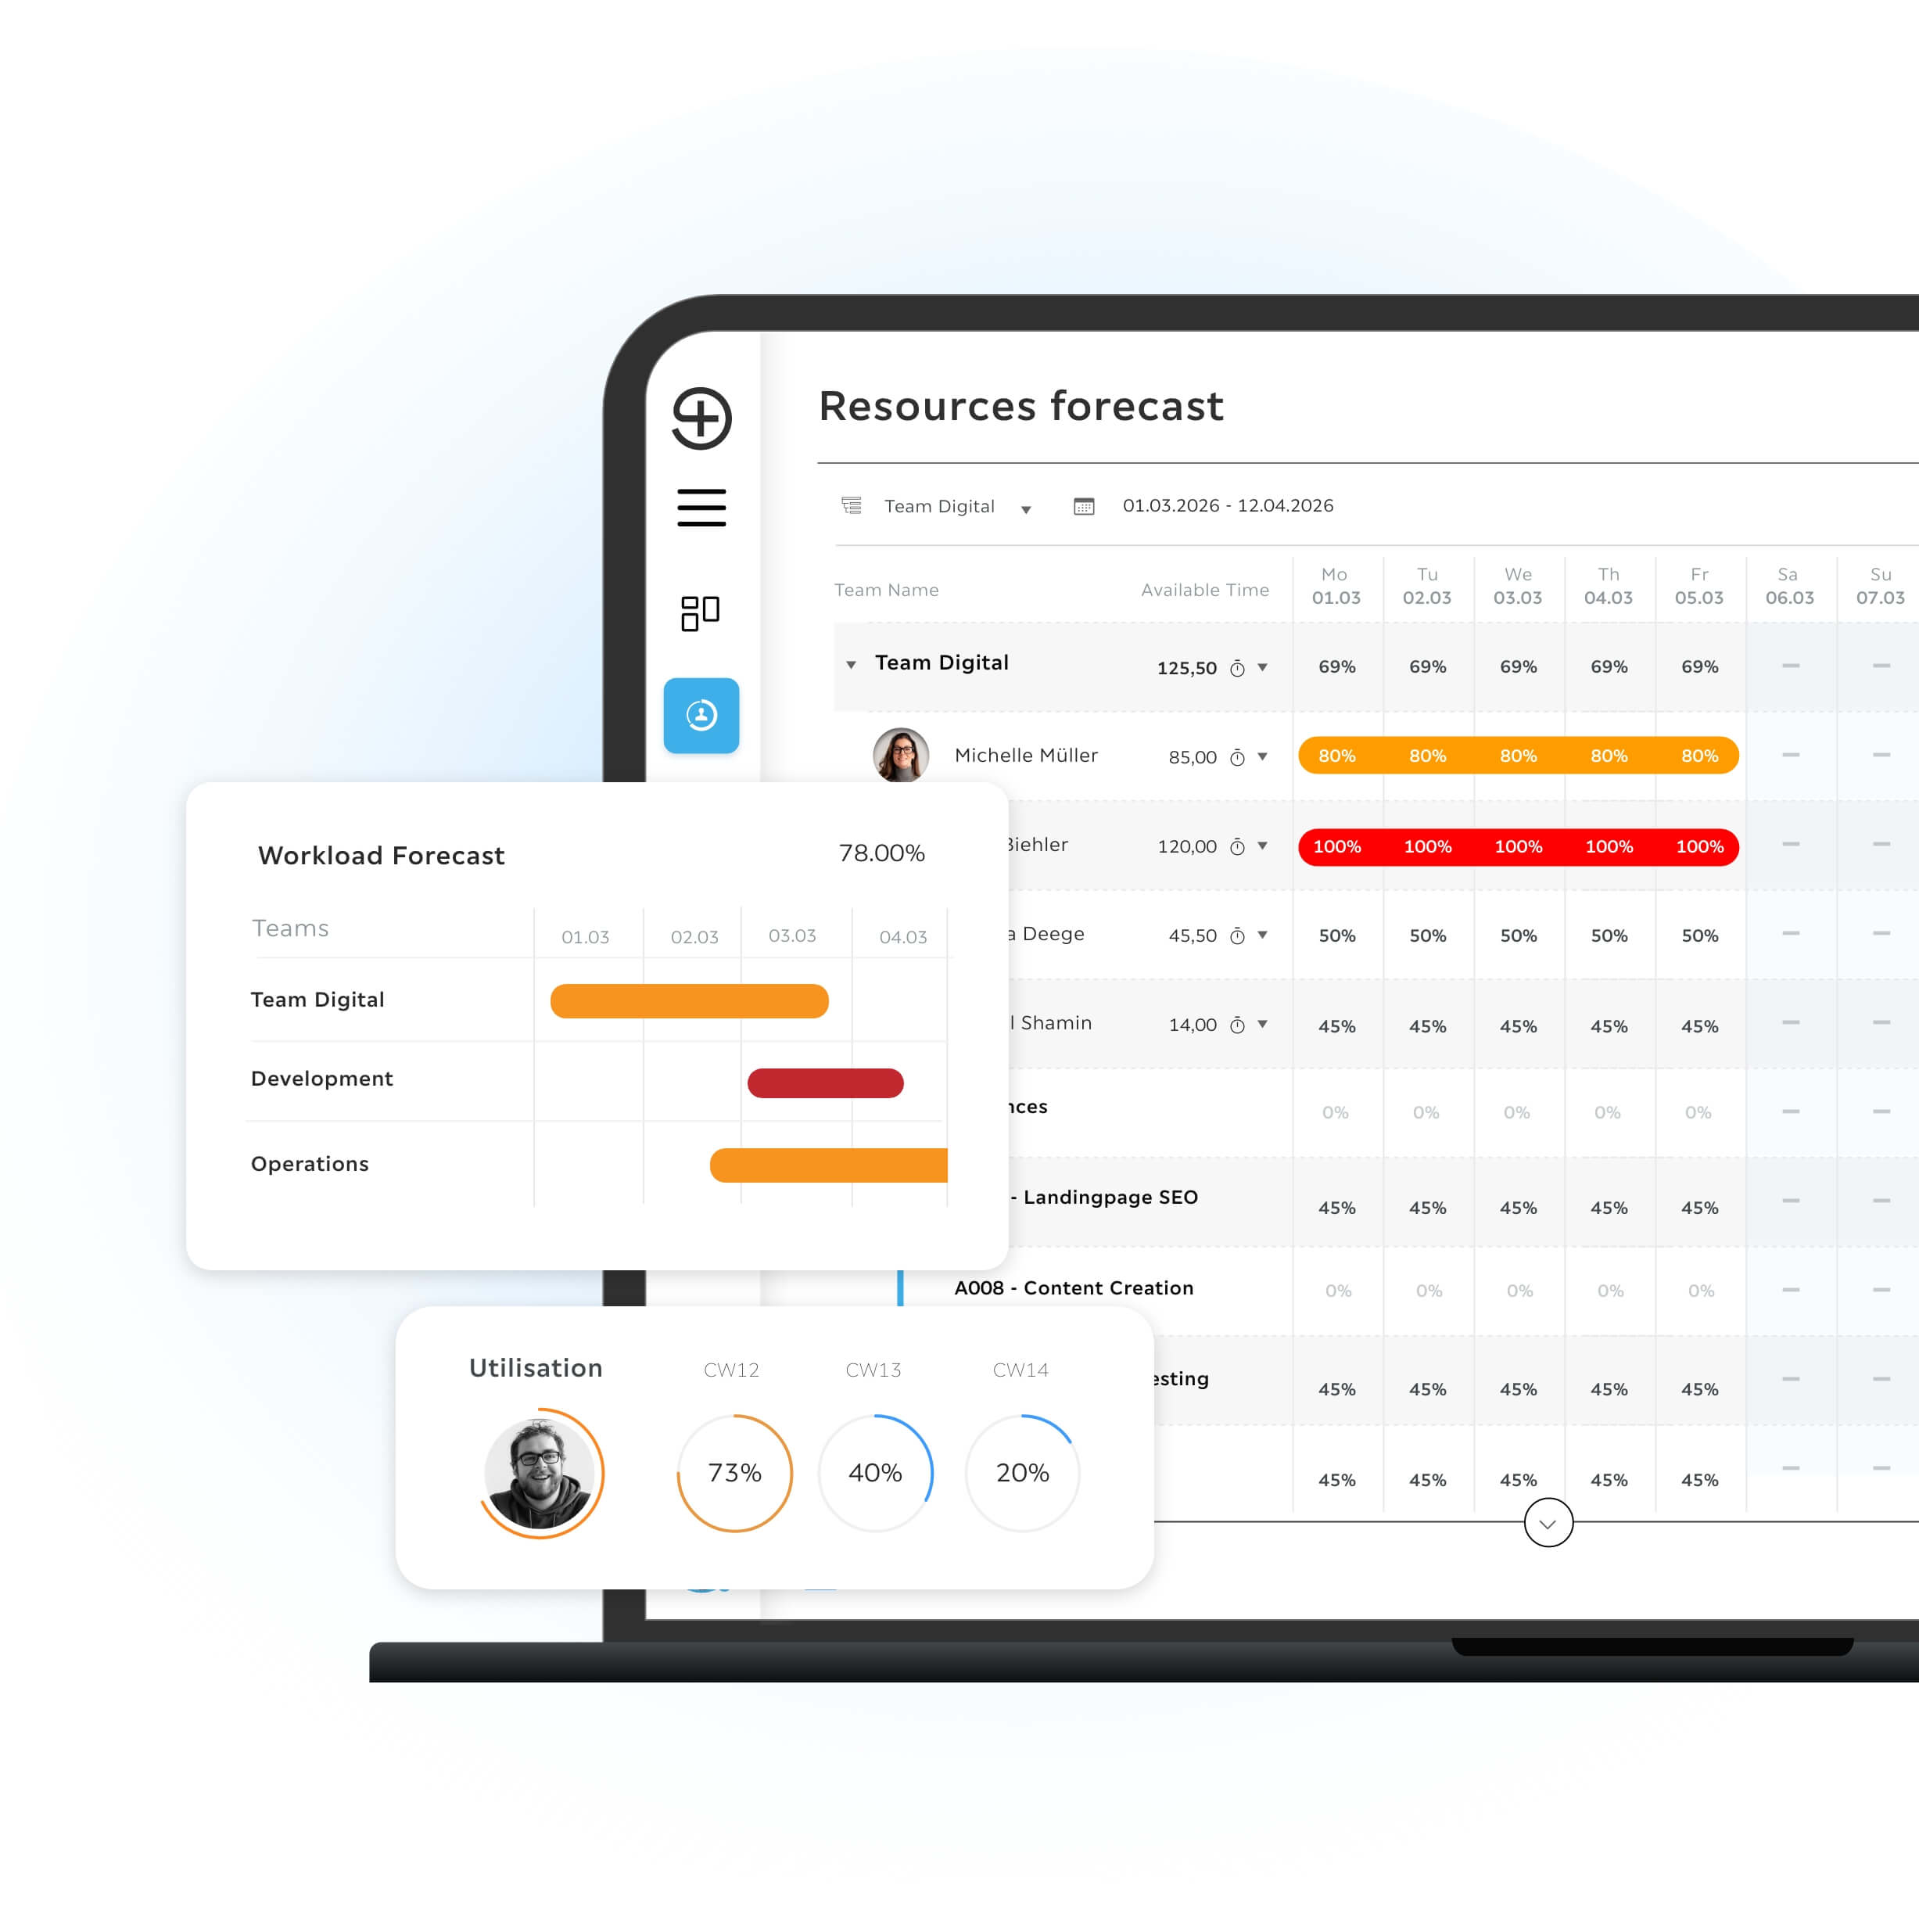
Based on the data available in troi, several dashboards were developed to help HIRSCHTEC retrieve key performance indicators quickly and in a visually accessible way. An automated report with multiple dashboards uses real-time data from troi and visualizes all relevant metrics for monitoring project business.
Examples of dashboard insights:
- Share of non-billable activities per project (as an indicator of profitability)
- Utilization report at employee and team level, including share of billable utilization
- Remaining budget report: hours already booked against the planned budget, including the proportion of non-billable hours
- Time review report for checking booked hours and deriving insights for resource planning
- “Quoted projects” view to display projected workloads and revenues, serving as a basis for mid-term resource planning
Result
The dashboards implemented serve as a key decision-making foundation for internal optimization and structural adjustments at HIRSCHTEC. With real-time analytics, decisions can be made ad hoc, enabling faster and more agile project execution. Decision-makers have immediate access to the right data at all times, which supports short-, medium-, and long-term planning.