Case Study
pixelart: automated insights with troi and Power BI
From three days of manual Excel work to real-time insights at the push of a button. Discover how the digital agency pixelart transformed its project controlling by connecting troi with Power BI, enabling automated KPI dashboards, precise revenue forecasting, and a new level of financial transparency.
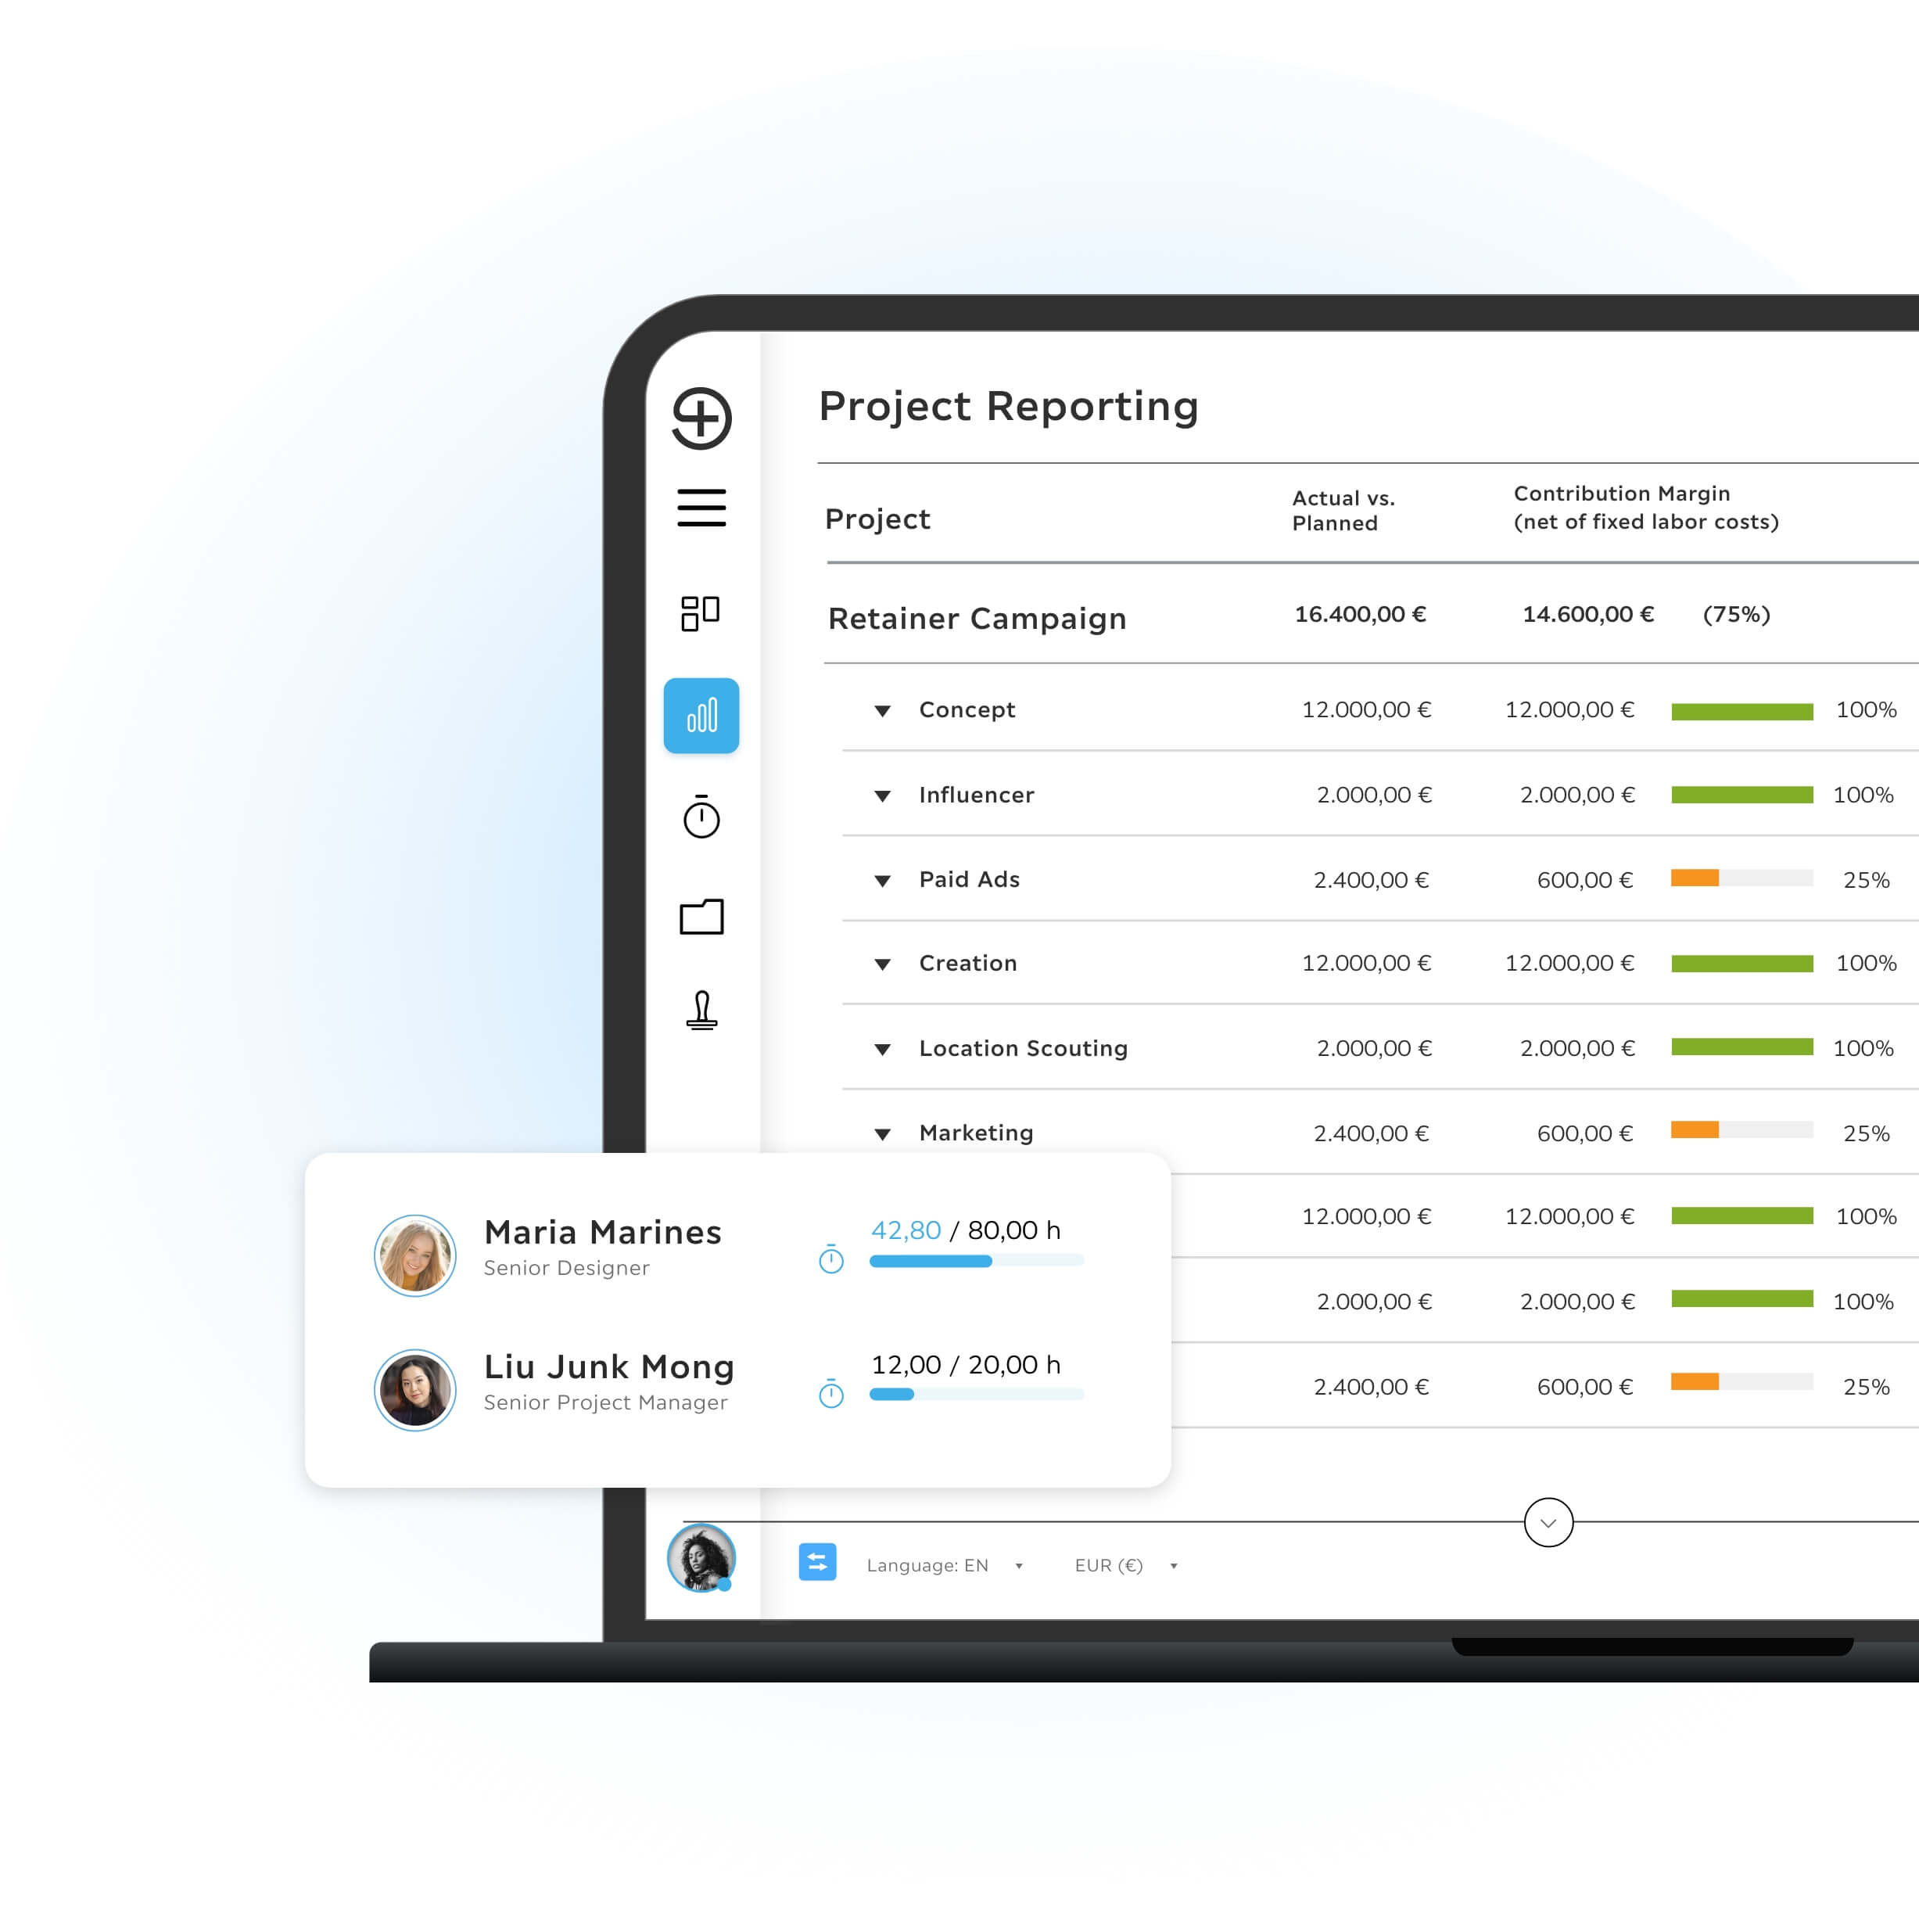
Custom KPI dashboards with troi and Power BI
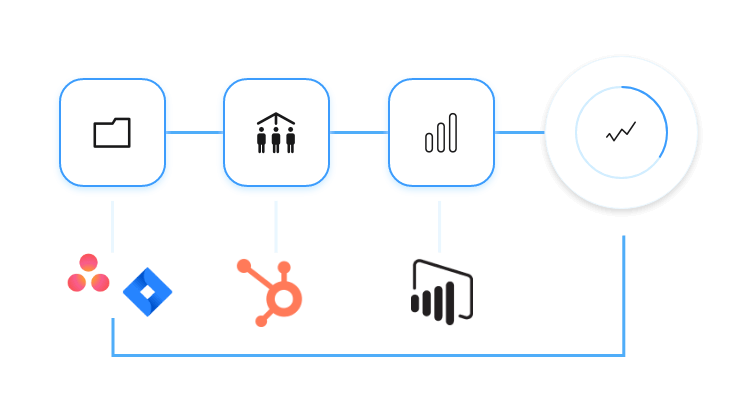
troi has been in use at pixelart for over ten years and serves as the central platform for daily project operations. By connecting troi with Power BI, pixelart replaced up to three working days of manual Excel reports every month with automated KPI dashboards built on live data from troi.
Profile
Mirja Wohlfeil is Assistant to the Board and responsible for Finance and Controlling at pixelart, a digital agency operating across Europe. It creates digital experiences that inspire users and support companies in achieving measurable success, and develops and activates brands, companies and startups across digital channels with a focus on delivering maximum value.
The real-time Power BI evaluations help us get a quick overview every day. Monthly evaluations are no longer necessary. Trends can be identified much earlier and acted upon.
 Mirja Wohlfeil, pixelart, Assistant to the Board
The challenge
To create team utilization reports, project status updates and revenue forecasts, data from troi was previously exported and manually combined in various Excel reports, which required up to three working days every month. To reduce manual workload and accelerate insight, a Power BI interface was implemented to automate reporting.
The solution
Custom Power BI dashboards were developed for pixelart, using live data transferred directly from troi. These dashboards present all relevant financial and project performance information in real time. Data structures were standardized and aligned with the accounting and billing process to ensure accurate revenue reporting and forecasting.
The dashboards include:
- Revenue reporting and forecasting at business unit level
- Client profitability overview
- Pipeline and sales development monitoring
Business performance report
The KPI report consolidates current-year revenue and a three-month revenue forecast and automatically highlights deviations at monthly and annual levels. The Sales Monitor displays the value of currently commissioned projects at client level, and the Lead Pipeline reflects the total value of all current proposals.
Client profitability
With the client profitability overview in the Power BI dashboards, client profitability can now be assessed based on revenue contribution, resource utilization, cost structures and performance trends over time. This transparency enables more accurate strategic decisions regarding account development and resource allocation.
Result
troi combined with Power BI enables pixelart to control projects, revenue flows and resource planning more precisely and with less administrative effort. pixelart now benefits from automated reporting instead of manual Excel work, real-time KPI dashboards for faster decision-making, more accurate revenue forecasting, clear visibility into client profitability and a reduced workload in Finance and Project Management.